

Editorial note: This article is intended to provide general information about HR technology, workforce analytics, and employee data management. Organizations should evaluate applicable employment, privacy, data-security, and other requirements for their circumstances.
HR teams collect more employee data than they may realize.
Every time someone applies for a job, completes onboarding, clocks in, requests time off, receives a paycheck, enrolls in benefits, completes training, receives a performance review, or leaves the organization, another piece of workforce data may be created.
The challenge isn't necessarily collecting more data.
It's connecting the information you already have well enough to answer useful questions.
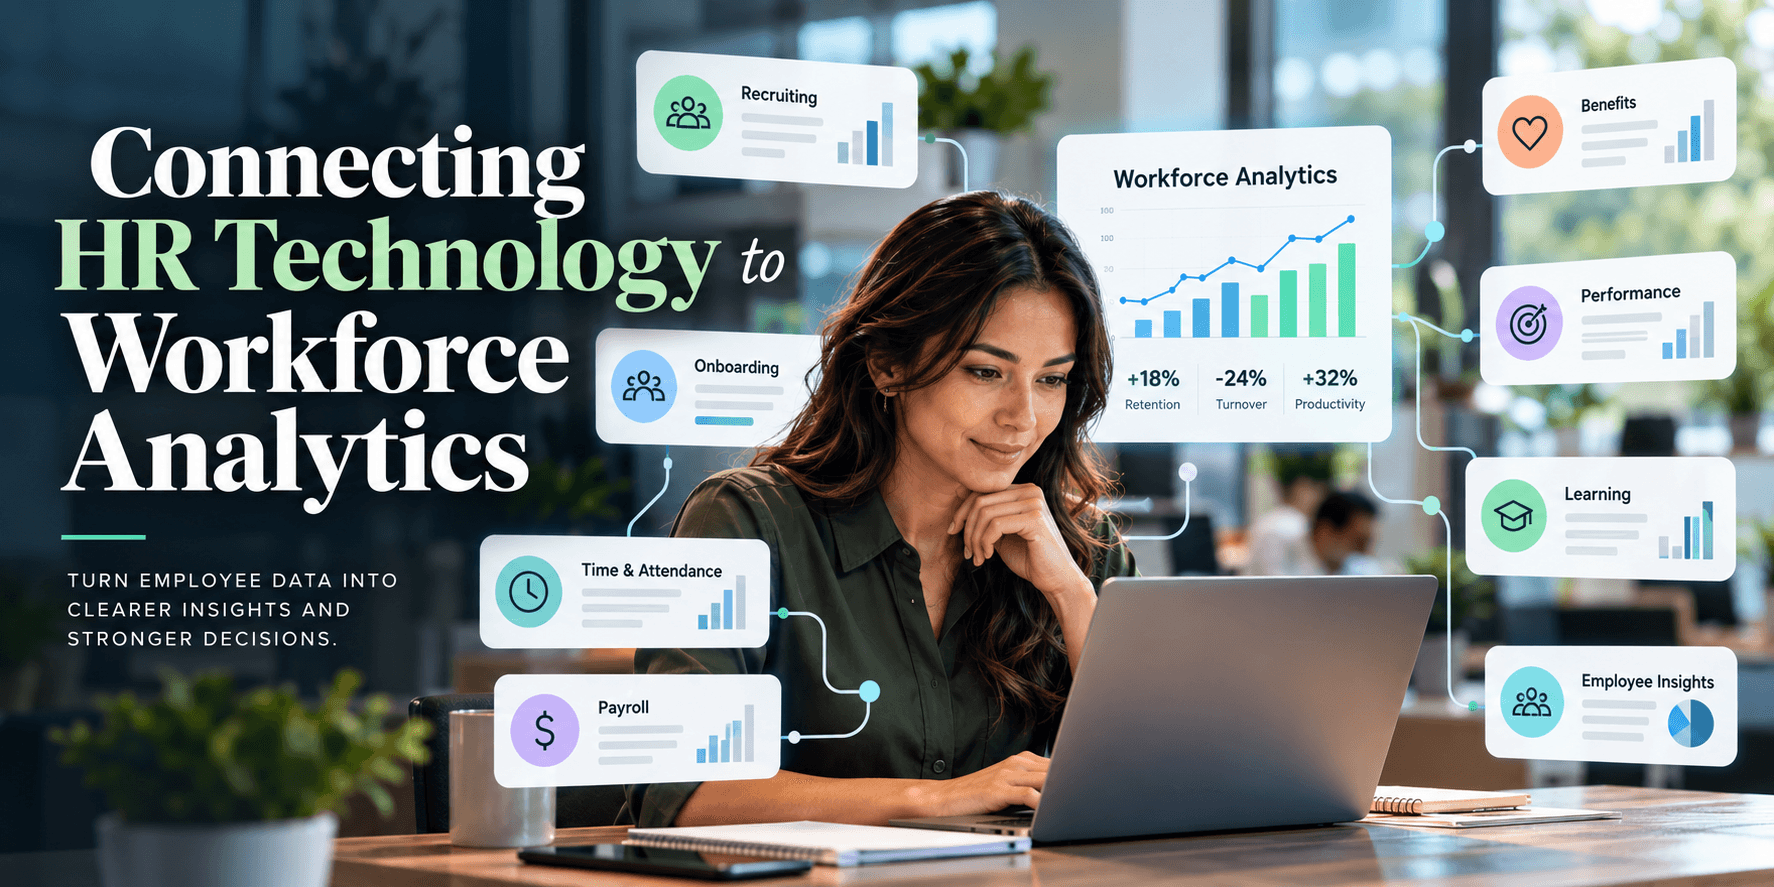
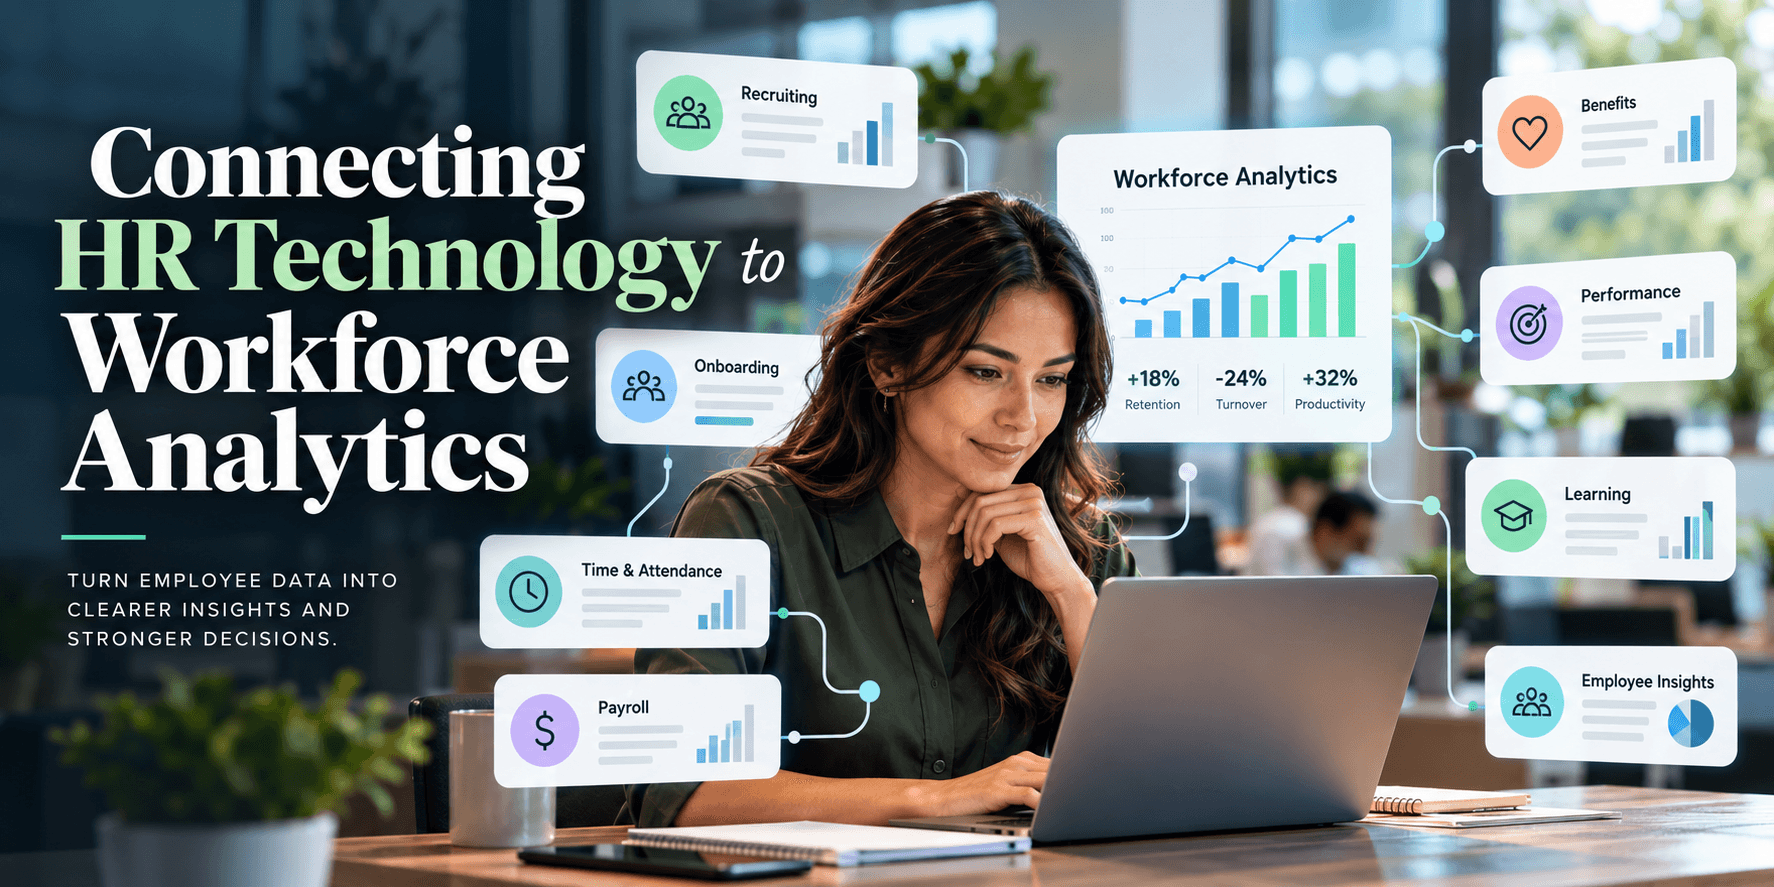
HR technology can improve employee data analytics by connecting workforce information from recruiting, onboarding, payroll, timekeeping, scheduling, benefits, performance, learning, and other HR processes so organizations can identify patterns, measure workforce outcomes, and make more informed decisions.
People analytics is commonly described as analyzing data about people to solve business problems, and relevant information can come from HR systems as well as other internal and external sources.
The goal isn't another dashboard.
It's being able to answer:
What is happening?
Where is it happening?
Why might it be happening?
What should we investigate?
What should we do next?
Key Takeaways
- HR technology can create and organize employee data throughout the employee lifecycle.
- Workforce analytics uses that information to investigate workforce and business questions.
- Connected systems can reduce manual data consolidation and improve consistency.
- Common areas of analysis include headcount, turnover, retention, hiring, attendance, overtime, labor costs, benefits, training, and performance.
- Reporting tells you what happened. Analytics helps investigate patterns and relationships.
- Correlation does not automatically establish causation.
- More employee data does not automatically produce better workforce decisions.
- AI and predictive analytics should support rather than replace appropriate human judgment, particularly when employment decisions could affect individuals.
- Workforce analytics should begin with a meaningful business question rather than a dashboard.
The HR Data-to-Decision Framework
A practical way to understand workforce analytics is:
Data → Metric → Pattern → Insight → Action
Data
An individual piece of workforce information.
Example: An employee worked 47 hours last week.
Metric
Data organized into something measurable.
Example: Overtime hours increased during the quarter.
Pattern
A recurring or concentrated change.
Example: Most of the overtime increase occurred at two locations.
Insight
Context that helps leaders understand what may be contributing to the pattern.
Example: Both locations also have several open positions and existing employees are covering additional shifts.
Action
A workforce or business response.
Example: Leadership investigates staffing levels, recruiting bottlenecks, schedules, workload, and overtime practices.
The important distinction is:
Having workforce data is not the same thing as having workforce insight.
What Is HR Technology?
HR technology is software and digital infrastructure used to manage employees and workforce processes.
Depending on the organization, HR technology can include:
- Human Resources Information Systems (HRIS)
- Human Capital Management (HCM) platforms
- Payroll
- Applicant Tracking Systems (ATS)
- Time and attendance
- Scheduling
- Benefits administration
- Learning Management Systems (LMS)
- Performance management
- Employee engagement tools
- Workforce analytics
- Employee self-service
The terminology and feature sets differ among technology providers, so organizations should evaluate what a platform actually does rather than relying solely on its category name.
What Is Employee Data Analytics?
Employee data analytics is the process of examining workforce information to identify trends, patterns, relationships, and potential areas for investigation or action.
For example:
Knowing 27 employees left last year is data.
Knowing 19 left during their first six months provides context.
Discovering that most early departures occurred at two locations identifies a pattern.
Finding that those locations also have higher overtime and longer hiring times creates a hypothesis worth investigating.
That does not establish that overtime or hiring delays caused employees to leave.
It tells HR where to look more closely.
CIPD specifically distinguishes concepts such as correlation, causation, predictive analytics, and prescriptive analytics within people analytics.
Data tells you what happened. Analytics helps you determine where to look next.
What Is Workforce Analytics?
Workforce analytics is the analysis of workforce data to understand patterns and support organizational decision-making.
People analytics, HR analytics, talent analytics, and workforce analytics are sometimes used interchangeably. CIPD describes people analytics broadly as analyzing people data to solve business problems.
Workforce analytics can help organizations investigate questions such as:
- Why is turnover increasing?
- Which departments use the most overtime?
- Which locations retain employees longest?
- How long does it take to fill positions?
- Where is absenteeism increasing?
- Which recruiting sources produce employees who remain longer?
- Are employees completing required training?
- Which teams appear consistently understaffed?
- What is labor costing each department?
- Are employees participating in available benefits?
- Where are workforce patterns changing?
Analytics does not necessarily provide the complete answer.
It helps leaders determine where to investigate and what questions to ask next.
HR Data vs. Metrics vs. Reporting vs. Analytics
| Term | Purpose | Example |
|---|---|---|
| HR data | Records workforce information | Employee worked 47 hours |
| HR metric | Measures something | Overtime increased this quarter |
| HR reporting | Describes what happened | Location A recorded 320 overtime hours |
| HR analytics | Investigates patterns and relationships | Overtime is concentrated in locations with several vacancies |
| Predictive analytics | Estimates possible future outcomes from historical patterns | A model identifies patterns associated with higher turnover |
| Prescriptive analysis | Helps evaluate possible responses | Leadership considers staffing or scheduling interventions |
The simplest distinction is:
Reporting describes. Analytics investigates.
How Do HR Technology Tools Improve Employee Data Analytics?
HR technology can improve employee data analytics by making workforce information more consistent, accessible, connected, and easier to analyze.
1. Centralizing Employee Information
Connected systems can reduce the number of separate places HR must search for workforce information.
2. Reducing Duplicate Data Entry
Integrations may reduce the need to repeatedly enter the same employee information into payroll, benefits, timekeeping, and other systems.
3. Standardizing Workforce Data
Consistent employee IDs, departments, locations, positions, and organizational structures make analysis easier and can improve data quality.
4. Automating Reporting
Recurring reports can often be generated without manually rebuilding spreadsheets every reporting period.
5. Connecting the Employee Lifecycle
Recruiting data becomes more useful when organizations can examine what happens after someone is hired.
Payroll becomes more useful when labor costs can be analyzed alongside time, staffing, and scheduling.
6. Making Patterns Easier to Detect
Analytics tools can help leaders identify changes in turnover, overtime, hiring, attendance, labor cost, training, and other workforce measures.
The opportunity isn't simply collecting more data. It's reducing the distance between a workforce question and the information needed to investigate it.
Where Does Workforce Analytics Data Come From?
Workforce analytics can combine information from multiple sources.
Applicant Tracking Systems
Candidates, applications, recruiting sources, interview stages, offers, and hiring timelines.
HRIS or HCM Systems
Employee status, tenure, department, location, manager, job information, and employment history.
Payroll
Wages, overtime costs, bonuses, deductions, headcount-related information, and labor costs.
Time and Attendance
Hours, attendance, absences, overtime, and PTO.
For covered employers and employees, federal FLSA recordkeeping rules require certain wage and hour records. The Department of Labor says required records include items such as hours worked, wage basis, regular hourly rate where applicable, overtime earnings, additions or deductions, total wages, and payment information.
Scheduling
Scheduled hours, shift coverage, and staffing patterns.
Benefits Administration
Eligibility, enrollment, participation, and benefit deductions.
Learning Management
Assigned training, completion, and certifications.
Performance Management
Goals, reviews, feedback, and development activity.
Employee Feedback
Survey responses, engagement information, exit feedback, and other qualitative information.
Business Systems
Revenue, productivity, quality, customer outcomes, and operational information.
This final category can be particularly valuable because workforce analytics becomes more strategically useful when organizations can examine relationships between people measures and business outcomes.
What HR Metrics Should Companies Track?
There is no universal list of metrics every company needs.
Start with the question the organization is trying to answer.
Headcount
Definition: The number of employees included within a defined workforce population at a particular point or period, according to the organization's methodology.
BLS, for example, defines employment for JOLTS according to a specific survey methodology that includes people on payroll who worked or received pay for the pay period containing the 12th of the month. That illustrates why organizations should define their own reporting populations clearly rather than assuming every source calculates headcount identically.
Question: Where is our workforce growing or shrinking?
Turnover
Definition: Employee separations measured relative to a defined workforce population and period.
Organizations should document exactly how they calculate turnover because methodologies can differ.
For example, BLS's JOLTS program defines separations as employees separated from payroll during the month and separately reports quits, layoffs and discharges, and other separations. Its published separation rates use its own defined employment denominator.
Question: Is turnover concentrated by tenure, location, role, manager, or another relevant segment?
Retention
Definition: A measure of employees who remain within a defined workforce population over a specified period.
Question: Which teams retain employees particularly well, and what can we learn from them?
Time-to-Hire
Definition: A recruiting measure of the time required to move a candidate through a defined portion of the hiring process.
Because organizations and platforms may define starting and ending points differently, the methodology should be documented.
Question: Where are hiring-process bottlenecks occurring?
Early Turnover
Definition: Employee departures occurring within an organization-defined early-tenure period, such as 90 days, six months, or one year.
Question: Are employees leaving before becoming established in their roles?
Absenteeism
Definition: Employee absence measured according to an organization's defined methodology.
Question: Are absences concentrated by location, shift, department, or period?
Overtime
Definition: Hours subject to applicable overtime rules and organizational reporting practices.
Federal wage-and-hour requirements are only one part of the analysis; applicable state requirements can also matter. The Department of Labor requires covered employers to maintain specified records concerning hours and wages for employees subject to relevant FLSA provisions.
Question: Is overtime associated with vacancies, scheduling, workload, seasonality, or another factor?
Labor Cost
Definition: Workforce compensation and related costs analyzed according to the organization's accounting and reporting methodology.
Question: Where are labor costs changing fastest?
Benefits Participation
Definition: Participation in a benefit among the relevant eligible workforce population.
Question: Are employees using the programs the organization offers?
Training Completion
Definition: Completion of assigned or required training during a defined period.
Question: Which employees, teams, or locations are falling behind?
Which HR Metrics Should Be Connected?
| Business Question | Data Worth Examining Together |
|---|---|
| Why is turnover increasing? | Separations + tenure + location + manager + scheduling + overtime + compensation + employee feedback |
| Why is overtime increasing? | Overtime + vacancies + scheduling + recruiting + absences |
| Why are new hires leaving? | Recruiting + onboarding + training + manager + schedule + tenure |
| Why are labor costs increasing? | Payroll + headcount + overtime + scheduling + vacancies |
| Why is one location different? | Staffing + turnover + overtime + attendance + management + business outcomes |
| Is training effective? | Training + performance + retention + relevant operational outcomes |
| Is recruiting effective? | Recruiting source + hiring speed + retention + relevant post-hire outcomes |
These combinations should generate questions and hypotheses, not automatic conclusions about causation.
Scenario: Turnover Is Increasing
Leadership says:
“We're losing too many people.”
HR first determines whether departures actually increased.
Then it segments the information.
Most of the increase comes from employees with less than six months of tenure.
Those departures are concentrated in two locations.
Those locations also show higher overtime.
Recruiting data shows several open positions.
Scheduling data shows existing employees covering additional shifts.
HR now has a more useful question:
Are staffing conditions, onboarding, scheduling, management, compensation, or other factors contributing to early turnover at these locations?
Analytics has not proven the answer.
It has narrowed the investigation.
Scenario: Overtime Suddenly Increases
Payroll shows overtime expense increased.
Timekeeping identifies where additional hours occurred.
Scheduling shows which shifts were affected.
HR data indicates several positions are vacant.
Applicant tracking shows some vacancies have remained open longer than usual.
Now leaders can investigate a possible relationship:
Vacancies → staffing pressure → additional employee hours → higher overtime
That is a hypothesis.
Additional analysis and human context are needed before claiming that one factor caused another.
Scenario: Recruiting Looks Successful but Retention Doesn't
Recruiting metrics look strong.
Positions are being filled faster.
Candidate volume is healthy.
But several months later, many new hires are gone.
Connecting recruiting and employee lifecycle information allows HR to ask:
- Which recruiting sources produce employees who remain longer?
- Which roles experience the most early turnover?
- Does turnover vary by location or manager?
- Are onboarding completion patterns different?
- Are employees receiving an accurate picture of the role before accepting?
Hiring faster isn't necessarily a better business outcome if the same positions repeatedly need to be filled.
Scenario: One Location Is Performing Differently
One of six locations consistently shows:
Lower turnover.
Lower overtime.
Higher training completion.
Fewer vacancies.
Instead of only investigating struggling locations, HR examines the successful one.
Are schedules different?
Is onboarding completed sooner?
Are staffing levels different?
Are managers providing feedback more consistently?
Workforce analytics can help organizations investigate what appears to be working as well as what isn't.
What Is a Single Source of Truth in HR?
A single source of truth is an approach to data management in which the organization establishes authoritative sources and rules for workforce information.
It does not require every HR function to exist in one platform.
Organizations should know:
- Which system owns each important data field
- How systems exchange information
- How frequently information updates
- Who can modify records
- Which reports leadership should rely on
If HR and Finance produce different headcounts, the organization needs to reconcile the definitions and underlying information before drawing conclusions from either number.
What Is HR Data Management?
HR data management is the process of collecting, maintaining, organizing, integrating, protecting, governing, and retaining workforce information.
Important dimensions include:
Accuracy: Is the information correct?
Completeness: Is important information missing?
Consistency: Are definitions aligned across systems?
Timeliness: Is information current?
Ownership: Who is responsible for maintaining it?
Access: Who can view or modify it?
Security: How is sensitive information protected?
Retention: How long should information be maintained?
Purpose: Why is the organization collecting and using the information?
Analytics built on unreliable information can produce unreliable conclusions.
Before asking whether your analytics are sophisticated enough, ask whether you trust the data underneath them.
What Is HR Data Hygiene?
HR data hygiene is the ongoing practice of keeping workforce information accurate, complete, consistent, current, and usable.
Common issues can include:
- Duplicate employee records
- Inconsistent job titles
- Different department names across systems
- Missing dates
- Outdated manager assignments
- Incorrect locations
- Inconsistent employment status
- Different employee identifiers across platforms
If one system calls a department “Customer Success,” another calls it “Client Services,” and a third uses “CS,” combined reporting may need normalization before it is reliable.
How Do You Know Whether HR Data Is Ready for Analytics?
Ask:
- Do our systems agree on basic workforce counts?
- Are departments and locations defined consistently?
- Do employees have consistent identifiers across connected systems?
- Are start and termination dates accurate?
- Are manager relationships current?
- Are employment statuses accurate?
- Do we identify missing values?
- Do we control duplicate records?
- Do we know which system owns each important field?
- Can we calculate the same metric twice using the same methodology and receive the same answer?
If not, data quality may deserve attention before another analytics tool is added.
Descriptive vs. Diagnostic vs. Predictive vs. Prescriptive Analytics
CIPD discusses descriptive, predictive, and prescriptive approaches to people analytics and emphasizes important concepts such as correlation and causation.
Descriptive Analytics: What Happened?
Example: Turnover increased.
Diagnostic Analytics: Where and Why Might It Be Happening?
Example: Most of the increase is concentrated among recently hired employees in three locations.
Predictive Analytics: What Might Happen?
Example: A model identifies historical workforce patterns associated with higher likelihoods of a particular outcome.
Predictive results are estimates, not certainty.
Prescriptive Analytics: What Might We Consider Doing?
Example: Leadership evaluates possible interventions involving onboarding, staffing, scheduling, management practices, or compensation.
The progression is:
What happened? → What patterns might explain it? → What might happen? → What might we do?
What Are the Stages of HR Analytics Maturity?
The following is a practical framework for thinking about analytics maturity. It is an editorial framework, not an official government standard.
Stage 1: Data Collection
Where is our workforce information?
Stage 2: Reliable Reporting
What happened?
Stage 3: Diagnostic Analytics
Where is it happening, and what patterns might explain it?
Stage 4: Predictive Analytics
What historical patterns may be associated with future outcomes?
Stage 5: Decision Intelligence
How should this information contribute to business and workforce decisions?
Organizations do not need sophisticated AI to benefit from analytics.
Reliable reporting built on trustworthy data is more useful than sophisticated analytics built on unreliable information.
How Can HR Analytics Connect to Business Outcomes?
Workforce analytics becomes more strategically useful when workforce measures are connected with relevant business measures.
For example:
Workforce metric: Employee turnover
Business metric: Customer retention
Question:
Do locations experiencing higher employee turnover also show changes in customer retention?
Or:
Workforce metric: Training completion
Business metric: Quality
Question:
Do teams completing a particular training program show different quality outcomes?
Or:
Workforce metric: Vacancies
Business metric: Overtime expense
Question:
Does prolonged understaffing occur alongside increased overtime expense?
These relationships can create hypotheses.
They do not, by themselves, prove causation.
How Can HR Analytics Help Measure ROI?
HR analytics can help organizations evaluate whether workforce investments correspond with changes in relevant outcomes.
Imagine an organization redesigns onboarding.
Before implementation:
Early turnover is relatively high.
Training completion is inconsistent.
After implementation:
Training completion improves.
Early turnover decreases.
That is useful evidence, but it does not automatically prove the onboarding redesign caused the change.
Other factors may also have changed.
A stronger evaluation asks:
- What changed?
- When did it change?
- Who was affected?
- What else changed during the same period?
- Was there a comparison group?
- Did the result persist?
- What other explanations are plausible?
That distinction makes HR analytics more credible.
Quantitative vs. Qualitative HR Data: Why Do You Need Both?
Quantitative data tells you what can be measured.
Turnover increased.
Overtime rose.
Absences changed.
Hiring took longer.
Qualitative information can provide context about what employees and managers are experiencing.
Examples include:
- Exit interviews
- Employee surveys
- Open-text feedback
- Stay interviews
- Manager conversations
- Focus groups
CIPD's people analytics guidance recognizes both quantitative and qualitative data as relevant concepts in analytics.
Numbers may help tell you where to look.
People may help you understand what is happening there.
How Should Organizations Protect Employee Data?
Workforce analytics can involve sensitive employee information, so organizations should evaluate privacy, security, access, retention, and appropriate use based on the data and applicable requirements.
Useful questions include:
- Who needs access?
- What information do they actually need?
- Can reporting be aggregated?
- How long should data be retained?
- Which vendors can access it?
- How are integrations secured?
- What happens when data is exported?
- Can employees' information be used by AI tools?
- Who reviews consequential analytics?
NIST's Privacy Framework is designed to help organizations identify and manage privacy risk, while its broader risk-management resources integrate privacy and security considerations into organizational systems.
Should Workforce Analytics Be Aggregated?
In many cases, aggregated information may answer a leadership question without exposing unnecessary individual-level data.
For example, leadership may need:
Location A turnover: 22%
It may not need the names of every individual included in that calculation.
Whether aggregation, de-identification, or individual-level analysis is appropriate depends on the purpose, data, technology, and applicable requirements.
Can AI Improve Workforce Analytics?
AI-enabled technology can assist with tasks such as identifying patterns, summarizing information, generating reports, and helping users explore datasets.
But organizations should also ask:
- What information can the AI access?
- Where is that information processed?
- How is it protected?
- Who can see the output?
- How accurate are the results?
- Can the results be explained?
- Could inappropriate bias affect the result?
- Is human review required?
- Is the AI being used to inform an employment decision?
NIST's AI Risk Management Framework identifies trustworthiness considerations including validity and reliability, security, transparency, explainability, privacy, and fairness, and provides a voluntary framework for managing AI risk.
The U.S. Department of Labor's AI best-practices guidance has also emphasized meaningful human oversight for significant employment decisions, transparency, worker rights, and protection of worker data.
The EEOC has separately published resources concerning the use of software, algorithms, and AI in assessing job applicants and employees under federal employment discrimination laws, including the ADA.
AI can accelerate analysis. It does not eliminate the need for governance, context, privacy, appropriate human oversight, or accountability.
Can HR Technology Predict Which Employees Will Quit?
Some analytics systems may use historical data to identify patterns associated with employee turnover.
That is different from knowing why a particular employee will leave or knowing with certainty that they will leave.
A more accurate interpretation is:
“The model identified characteristics historically associated with a particular outcome.”
not:
“The system knows this employee is going to quit.”
Predictive outputs should be treated as estimates and evaluated carefully, particularly when analytics could influence consequential employment decisions. NIST's AI framework emphasizes managing risks around validity, reliability, transparency, privacy, explainability, and harmful bias.
What Are Common HR Analytics Mistakes?
Starting With the Dashboard Instead of the Question
Start with:
What workforce problem are we trying to understand?
Tracking Everything
More metrics can create more noise.
Confusing Correlation With Causation
Two variables moving together does not establish that one caused the other.
Ignoring Segmentation
Company averages can hide important differences among locations, roles, departments, shifts, managers, and tenure groups.
Using Inconsistent Definitions
If Finance and HR calculate headcount differently, reports can conflict even when neither calculation contains a technical error.
Ignoring Data Quality
Sophisticated analytics cannot compensate for unreliable source information.
Ignoring Human Context
Employee feedback can provide information that numerical metrics cannot.
Collecting Data Without Acting
A dashboard creates limited value if nobody uses it to investigate or improve decisions.
Can Small Businesses Use Workforce Analytics?
Yes.
A smaller organization can begin with questions such as:
- How many employees left this year?
- When did they leave?
- Which roles are hardest to fill?
- Where is overtime highest?
- Which teams experience the most absences?
- How long does onboarding take?
- Are employees completing required training?
- Which workforce costs are changing?
Workforce analytics does not have to begin with predictive modeling.
It can begin with one important question and reliable data.
What Should HR Leaders Look for in Workforce Analytics Technology?
Ask whether the system can:
- Connect information across the employee lifecycle
- Integrate payroll and HR information
- Maintain consistent employee records
- Segment reports appropriately
- Monitor trends over time
- Drill into aggregate metrics
- Define metrics consistently
- Export information when needed
- Provide role-based access
- Reduce duplicate data entry
- Support appropriate integrations
- Protect sensitive employee information
- Produce understandable reports
- Connect workforce measures with relevant business outcomes
Then ask:
Can this technology help us answer the workforce questions we actually have?
Hundreds of reports do not matter if the answer is no.
15 Questions HR Leaders Should Ask About Their Workforce Data
- Where does our employee data live?
- Which system is authoritative for each type of information?
- Do our systems agree on basic workforce counts?
- Are employee identifiers consistent?
- Where are we entering the same information more than once?
- Are departments and locations defined consistently?
- Which workforce metrics does leadership actually use?
- How are those metrics defined?
- Can results be segmented appropriately?
- Can payroll and HR information be analyzed together?
- Can recruiting information connect to post-hire outcomes?
- Can training information connect to relevant workforce outcomes?
- Which reports still require manual spreadsheet work?
- Who has access to sensitive workforce information?
- What important workforce question can we currently not answer?
The final question may tell you more about your HR technology than the feature list.
Frequently Asked Questions About HR Technology and Workforce Analytics
How does HR technology improve employee data analytics?
HR technology can improve employee data analytics by collecting workforce information consistently, connecting data across HR processes, automating reporting, and making patterns easier to identify.
Connected systems can reduce time spent assembling information and give HR teams more opportunity to investigate workforce questions.
What is the difference between HR reporting and HR analytics?
HR reporting describes what happened. HR analytics investigates patterns, relationships, and possible explanations.
A report might show turnover increased.
Analytics asks where the increase occurred, which employees or locations were affected, what other workforce conditions changed, and what should be investigated.
What is people analytics?
People analytics is broadly the analysis of people data to address business problems. The term is sometimes used interchangeably with HR analytics, talent analytics, and workforce analytics.
What employee data should HR track?
Useful information can include headcount, tenure, separations, retention, recruiting, attendance, overtime, labor costs, benefits, training, performance, and other relevant workforce information.
The better question is:
Which data do we need to answer the workforce questions that matter to our organization?
Why should payroll and HR technology be connected?
Connecting payroll and HR information can provide additional context around labor costs, headcount, overtime, employee status, departments, locations, and workforce trends while potentially reducing duplicate data entry.
What is an HR analytics dashboard?
An HR analytics dashboard is an interface for displaying workforce measures and trends.
A dashboard becomes more valuable when the information is connected to questions and decisions rather than simply displayed.
Can workforce analytics reduce turnover?
Analytics itself does not reduce turnover.
It can help organizations identify where departures are occurring, which groups are affected, when employees leave, and what patterns deserve further investigation.
People and organizational decisions determine what happens next.
Can workforce analytics help control labor costs?
Workforce analytics can help organizations investigate labor costs alongside staffing, overtime, vacancies, scheduling, and other relevant information.
That information can support workforce and operational decisions.
Does a company need an HRIS for workforce analytics?
Not necessarily.
Organizations can analyze workforce information from multiple sources, although connected HR technology can reduce manual preparation and help maintain more consistent employee information.
What is predictive HR analytics?
Predictive HR analytics uses historical information and analytical models to estimate possible future workforce outcomes or identify patterns associated with those outcomes.
Predictions are estimates, not certainties.
What is HR data hygiene?
HR data hygiene is the ongoing practice of keeping workforce information accurate, complete, consistent, current, and usable.
What is a single source of truth in HR?
It is an approach that establishes authoritative sources and definitions for important workforce information so leaders are not relying on conflicting versions of the same data.
Does more HR data mean better decisions?
No.
Data needs to be relevant, sufficiently accurate, appropriately interpreted, and connected to a meaningful question.
Can AI analyze employee data?
AI-enabled systems can assist with some forms of workforce analysis, depending on the technology and use case. Organizations should consider privacy, security, validity, transparency, fairness, applicable employment requirements, and appropriate human oversight.
How Can HR Leaders Turn Workforce Data Into Action?
Use this framework:
1. Question
What are we trying to understand?
2. Data
Which information could help answer it?
3. Segment
Where and among whom is the pattern occurring?
4. Analyze
What changed, when, and alongside what else?
5. Hypothesize
What could explain the pattern?
6. Add Human Context
What are employees and managers experiencing?
7. Act
What reasonable intervention should the organization evaluate?
8. Measure
What happened after the change?
Then repeat:
Question → Data → Analysis → Human Context → Action → Measurement → Better Question
From Employee Data to Workforce Decisions
The biggest opportunity in HR technology isn't simply collecting more employee data.
Most organizations already have a significant amount.
The opportunity is connecting information well enough to understand what it may be telling you.
A turnover number becomes more useful when you understand who is leaving, when they're leaving, and where departures are concentrated.
An overtime number becomes more useful when you can examine it alongside staffing, scheduling, vacancies, and recruiting.
A recruiting metric becomes more useful when you can examine what happens after someone gets hired.
Training data becomes more useful when you can investigate its relationship with performance, retention, quality, or another relevant outcome.
And a dashboard becomes more useful when it causes someone to ask a better question.
That's the value of workforce analytics: turning employee data into better questions, better investigation, and more informed workforce decisions.
What Should Your HR Technology Be Doing for You?
Start with one question your organization has struggled to answer.
Why are employees leaving?
Why is overtime increasing?
Why is one location performing differently?
Why are positions taking longer to fill?
Which recruiting sources produce employees who remain longer?
Where are labor costs changing?
Are our workforce investments producing the outcomes we expected?
Then ask whether your current HR technology gives you the information needed to investigate it.
If answering one question requires five exports, three spreadsheets, two systems, and hours of manual cleanup, the problem may not be that your organization needs more employee data.
You may need a better way to connect the data you already have.
Sources and Further Reading
U.S. Bureau of Labor Statistics, Job Openings and Labor Turnover Survey (JOLTS). Definitions and methodology for employment, hires, quits, layoffs and discharges, and other separations.
U.S. Department of Labor, Wage and Hour Division. FLSA recordkeeping requirements concerning employee identification, hours, wages, overtime, deductions, and payroll records.
CIPD, People Analytics Factsheet. Overview of people analytics, business applications, quantitative and qualitative information, correlation and causation, and descriptive, predictive, and prescriptive analytics.
National Institute of Standards and Technology, AI Risk Management Framework. Voluntary framework addressing AI risk and trustworthiness considerations including validity, reliability, transparency, explainability, privacy, security, and fairness.
U.S. Equal Employment Opportunity Commission. Resources addressing software, algorithms, artificial intelligence, job applicants, employees, and federal disability discrimination requirements.
U.S. Department of Labor, AI Best Practices. Guidance addressing human oversight, transparency, worker rights, worker data, and responsible use of AI in employment contexts.
Topics:
